Pollution of water ecosystem services
The first part of this research project is to construct a longitudinal dataset of ecological status for each Danish stream, lake and coastal water from 1990-2020. The data processing is outlined below. Ecological status is observed through biological indicators of eutrophication, which is the process of nutrient over-enrichment of waterbodies due to organic pollution from agriculture and point sources. Such pollution can lead to high growth of phytoplankton and thus oxygen depletion which leads to worse ecological conditions and loss of ecosystem services.
The second part consists of imputing missing values in the dataset. The imputed ecological status is presented in the figure below.
The third part applies valuation studies to be able to estimate the development in the Green National Accounts for Denmark. For surface water, we apply the Benefit Transfer function estimated by a meta analysis function (Zandersen et al, 2022 - English summary) to help answer the overall research question, to what extent economic growth can be considered sustainable or at the cost of the environment?
Identification of waterbodies
This project follows the selection and demarcation of waterbodies defined by the Danish waterbody plan for 2021-2027, VP3 (Vandområdeplan 3, MiM, 2023 - Danish), which implements phase three of the WFD (Water Framework Directive, European Parliament and Council of the EU, 2000). The surface waterbodies in VP3 are constituted by a total of 6703 streams, 986 lakes, and 108 coastal waters.
Assigning monitoring stations to waterbodies
Geographically, monitoring stations are recorded as point observations, streams are identified as vectors, while lakes and coastal waters constitute polygons. Official linkage tables link all waterbodies in VP3 with stations that have been monitored in recent years. MiljøGIS (MST, 2022 - Danish) interactively shows the demarcation and the result of the basis analysis of ecological status for streams and lakes (MST, 2019 - Danish) as well as the assessment for coastal waters (MST, 2021 - Danish). It also includes several newly developed indicators in a very thorough assessment of both ecological and chemical status, however, we ignore those to focus on the indicators that have been monitored since the late 1980s.
Ecological status of waterbodies
As a biological indicator of nutrient pollution, we use the concentration of chlorophyll a, which is a green pigment found in phytoplankton in lakes and coastal waters. For Danish streams, the long-lasting biological indicator of ecological conditions is the DVFI index (Dansk Vandløbsfaunaindeks) which measures the occurrence and composition of benthic macroinvertebrates (small bottom-living animals without backbone). The index is one of many modified versions of the Trent Biotic Index (TBI) that was developed in 1964 for the River Trent watershed in England (Andersen et al, 1984). In 1998 the Danish index was improved as observations before that were less consistent (MST, 1998 - Danish).
Field observations of said biological indicators show an overall improvement of the water environment since 1990 as illustrated in the following figure. However, since agricultural Nitrogen surplus peaked in the early 1980s, we are most likely only observing the latter half of an inverse U-shape of water pollution (Hansen et al, 2011).
Figure: Observed status (share of observed shore length with less than good ecological status)
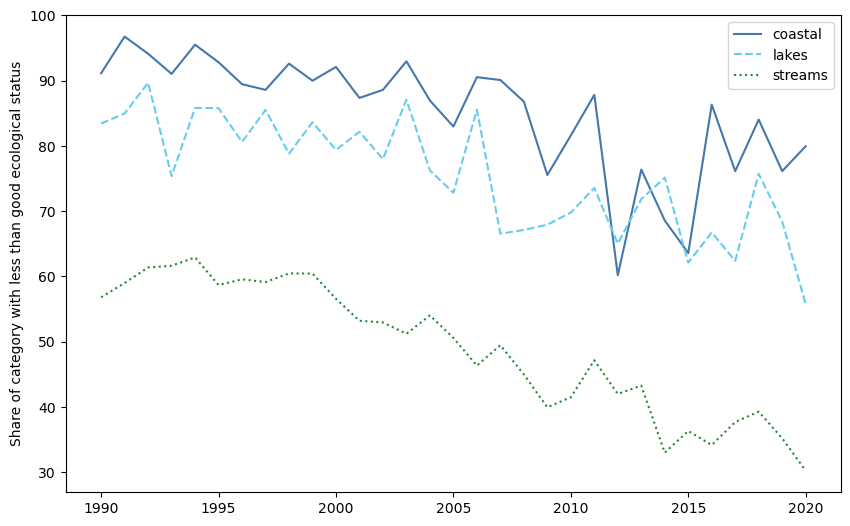 Source: Field observations in the surface water database, ODA (Overfladevandsdatabasen, DCE, 2024 - Danish)
Imputed ecological status
The figure above reveals that observed ecological status is very sensitive to year-by-year differences in weather conditions and composition of the subset of waterbodies being monitored the given year. Thus, to better illustrate the underlying trend, the figure below shows the estimated ecological status of the entire set of waterbodies in VP3 where missing values are imputed (Little & Rubin, 2019) and stochastic variation is smoothed out using a 5-year moving average for each waterbody. Effectively, we take into account observations for the extended period 1987-2022 as support for both imputation and the moving average calculation.
Figure: Imputed status (share of total shore length with less than good ecological status)
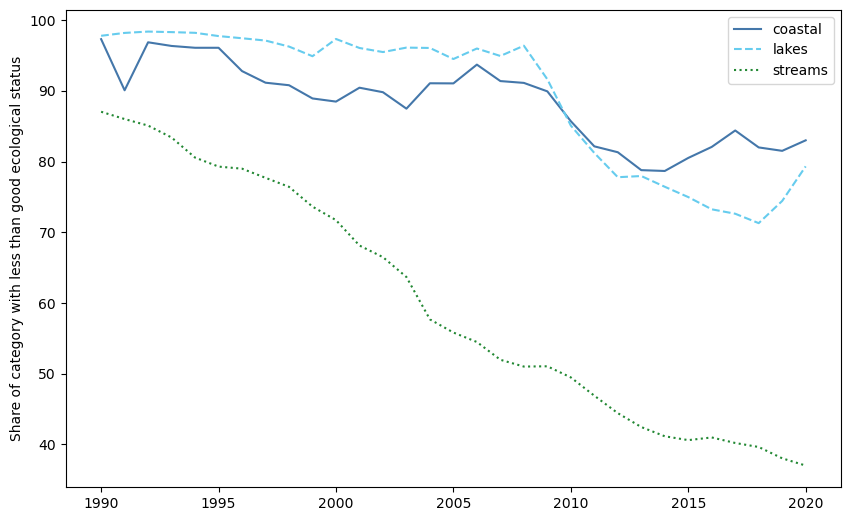 Source: Own calculations where we impute ecological status for all waterbodies in VP3 and use a 5-year moving average to reduce noise in individual years.
Assessment of streams
37,152 km is the he total shore length of streams included in VP3, of which 92% of streams representing 35,789 km (96% of total shore length) have been assessed at least once. On average, 21% of streams representing 10,839 km (29% of total shore length) are assessed each year. The composition as well as the extent of stations being monitored within a year has varied over the period, peaking at 46% of total shore length in 2002.
While the monitoring of water quality in Danish streams does cover the range of different pollution sources and physical conditions, imputation of missing values is necessary to correct for the overrepresentation of larger streams, which generally have higher water quality. Moreover, a Moderate to Bad ecological status can in some cases be caused by influence of ochre or poor physical conditions due to stream straightening or intensive dredging and cutting of water weeds (Baattrup-Pedersen, Kjær, & Kjelgaard, 2023 - English summary). Thus, the downward trend shown in the figure above should be taken with a grain of salt, but such overall improvement in water quality can be identified for many individual streams in the map book below.
From bottom fauna class to ecological status
If a station has multiple observations within a year, take the median and round down. Subsequently, do the same if a stream has observations for multiple stations within a year. Thus, a unique DVFI fauna class is obtained for each stream for every year it has been observed (MST, 2019 - Danish).
Finally, the seven fauna classes are converted to the five EU WFD categories of ecological status: Bad, Poor, Moderate, Good, or High (MiM, 2023, Appendix 3.A.3 - Danish).
The map book shows the ecological status of streams for each year from 1992-2019. As stands out, initially the DVFI index was mostly used in the two counties Viborg and Ringkjøbing (in mid-western Jutland).
If your browser does not allow you to navigate the map book, you can download it here instead.
Map book: Observed ecological status of streams each year
Data and reproducible code
See GitHub.com/ThorNoe/GreenGDP for data, code, and instructions on how to reproduce or update the figures.